| Columna |
|---|
|
| Columna | |
|---|---|
|
Required Software
Statistic and metric logging in TrinityCore is implemented using two projects, InfluxDB, a time-series data storage and Grafana, graph and a dashboard builder for visualizing time series metrics.
...
Download and install InfluxDB from https://influxdata.com/downloads/#influxdb for your platform
Nota Create n user and a database for TC using the Influx CLI
Bloque de código language sql theme Confluence CREATE DATABASE worldserver CREATE USER grafana WITH PASSWORD 'grafana' GRANT READ ON worldserver TO grafana
...
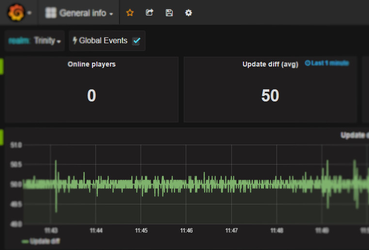
- Players online

- Logins per hour, per day, day of week, etc
- Mails sent

- Auction house usage
- Character levels
- Gold earn/spend
- LFG queues
...
| Info |
|---|
We'd like help implementing these and other metrics, feel free to send us a pull request. |
Adding new metrics
There are two kinds of metrics that can be logged: values and events.
...
- category: Same as above;
- value: A measurement, it can have one of the following types: bool, std::string, float, double or any integral type (int, int32, uint, etc).
| Bloque de código | ||||||||
|---|---|---|---|---|---|---|---|---|
| ||||||||
// Registering player logins: in WorldSession::HandlePlayerLogin(LoginQueryHolder* holder)
TC_METRIC_EVENT("player_events", "Login", pCurrChar->GetName());

// Logging the update diff time: in World::Update(uint32 diff)
TC_METRIC_VALUE("update_time_diff", diff); |
...
| Sección | ||||
|---|---|---|---|---|
InfluxDB is part of a bigger set of projects by InfluxData which integrate nicely with the DB:
|

...