| Tabla de contenidos |
|---|
Required Software
Statistic and metric logging in TrinityCore is implemented using two projects, InfluxDB, a time-series data storage and Grafana, graph and dashboard builder for visualizing time series metrics.
Installing InfluxDB
Download and install InfluxDB from https://influxdata.com/downloads/#influxdb for your platform
Nota Windows is not currently available officially but an older working version can be found at https://github.com/mvadu/influxdb/releases
Create an user and a database for TC using the Influx CLI
Bloque de código language sql theme Confluence CREATE DATABASE worldserver CREATE USER grafana WITH PASSWORD 'grafana' GRANT READ ON worldserver TO grafana
Installing Grafana
- Download and install Grafana from http://docs.grafana.org/installation/
- Open the dashboard at http://localhost:3000
- Login with username admin and password admin (defaults can be changed in Grafana's .ini files)
- Go to
Data Sources→+ Add Data Source
Name: Influx
Type: InfluxDB
Url: http://localhost:8086
Access: Proxy
Database: worldserver User: grafana Password: grafana - Go to
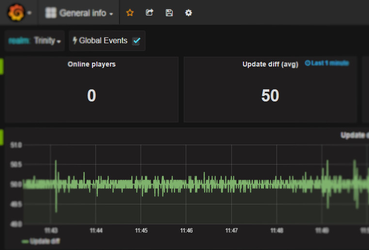
Dashboards→Importand import each .json file in TrinityCore's /contrib/grafana
Configuring TrinityCore
- Edit the worldserver.conf file
- Set
Metric.Enable = 1 - Edit
Metric.ConnectionInfowith connection details (e.g"127.0.0.1;8086;worldserver") - Start worldserver, the dashboard should now start receiving values
Adding new metrics
There are two kinds of metrics that can be logged: values and events.
...