Versiones comparadas

Clave

  • Se ha añadido esta línea.
  • Se ha eliminado esta línea.
  • El formato se ha cambiado.

Image Removed  


Columna

Image Added

Columna

Tabla de contenidos


Required Software

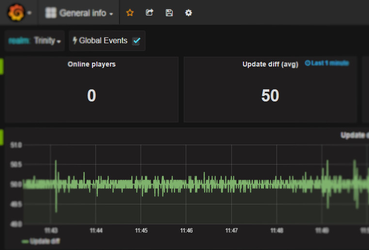
Statistic and metric logging in TrinityCore is implemented using two projects, InfluxDB, a time-series data storage and Grafana, graph and a dashboard builder for visualizing time series metrics.

...

Additional visualizations and metrics collection

Sección

InfluxDB is part of a bigger set of projects

...

by InfluxData which integrate nicely with the DB:

...


Columna

Image Added

Columna
  • Telegraf can be used to collect system metrics like CPU, I/O, memory usage and other services such as MySQL – to display this info next to the TC metrics.
  • Chronograf

...

  •  is an alternative to Grafana to graph and visualize time-series metrics.
  • Kapacitator

...

  •  is able to process streaming data from InfluxDB to provide alerts, trigger events, detect anomalies or transform data.

Additional Reading

Learn more about InfluxDB and Grafana:

...