Required Software
Statistic and metric logging in TrinityCore is implemented using two projects, InfluxDB, a time-series data storage and Grafana, graph and a dashboard builder for visualizing time series metrics.
Installing InfluxDB
Download and install InfluxDB from https://influxdata.com/downloads/#influxdb for your platform
Create a user and a database in InfluxDB using the Influx CLI and executing the commands below
CREATE DATABASE worldserver
CREATE USER grafana WITH PASSWORD 'grafana'
GRANT READ ON worldserver TO grafana
Installing Grafana
- Download and install Grafana from http://docs.grafana.org/installation/
- Open the dashboard at http://localhost:3000
- Login with username admin and password admin (defaults can be changed in Grafana's .ini files)
- Go to
Data Sources→+ Add Data Source
Name: Influx
Type: InfluxDB
Url: http://localhost:8086
Access: Proxy
Database: worldserver User: grafana Password: grafana - Go to
Dashboards→Importand import each .json file in TrinityCore's /contrib/grafana
Configuring TrinityCore
- Edit the worldserver.conf file
- Set
Metric.Enable = 1 - Edit
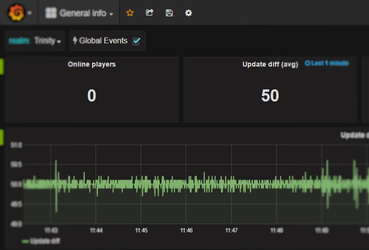
Metric.ConnectionInfowith connection details (e.g"127.0.0.1;8086;worldserver") - Start worldserver, the dashboard should now start receiving values
Implemented  and planned
  metrics
Technical oriented
- I/O networking traffic:
- Packets sent
- Packets received
- Average ping
- Traffic in
- Traffic out
- Packets sent
- World session update time
- Map update time
- Map loads/unloads
- MMap queries
- Database async queries queued count
- Server uptime (through world initialize and world shutdown events)
- Active connections
- Queued connections
Game oriented
- Players online
- Logins per hour, per day, day of week, etc
- Mails sent
- Auction house usage
- Character levels
- Gold earn/spend
- LFG queues
We'd like help implementing these and other metrics, feel free to send us a pull request.
Adding new metrics
There are two kinds of metrics that can be logged: values and events.
Values correspond to measurements of a certain quantity, like number of online players or the update diff time.
Events are something that occurs in an instant of time, e.g, a player login, worldserver shutdown, etc..
To log new metrics, call TC_METRIC_EVENT or TC_METRIC_VALUE and add a new graph to the dashboard.
TC_METRIC_EVENT(category, title, description)
- category: Arbitrary string, table where the values and events are stored. By convention, event logs should be suffixed by "_events";
- title: Name of the event log;
- description: Additional info about a log event;
TC_METRIC_VALUE(category, value)
- category: Same as above;
- value: A measurement, it can have one of the following types: bool, std::string, float, double or any integral type (int, int32, uint, etc).
// Registering player logins: in WorldSession::HandlePlayerLogin(LoginQueryHolder* holder)
TC_METRIC_EVENT("player_events", "Login", pCurrChar->GetName());

// Logging the update diff time: in World::Update(uint32 diff)
TC_METRIC_VALUE("update_time_diff", diff);
Additional visualizations and metrics collection
InfluxDB is part of a bigger set of projects by InfluxData which integrate nicely with the DB:

- Telegraf can be used to collect system metrics like CPU, I/O, memory usage and other services such as MySQL – to display this info next to the TC metrics.
- Chronograf is an alternative to Grafana to graph and visualize time-series metrics.
- Kapacitator is able to process streaming data from InfluxDB to provide alerts, trigger events, detect anomalies or transform data.
Additional Reading
Learn more about InfluxDB and Grafana: