Required Software
Statistic and metric logging in TrinityCore is implemented using two projects, InfluxDB, a time-series data storage and Grafana, graph and a dashboard builder for visualizing time series metrics.
Installing InfluxDB
Download and install InfluxDB from https://influxdata.com/downloads/#influxdb for your platform
Windows is not currently available officially but an older working version can be found at https://github.com/mvadu/influxdb/releases
Create an user and a database for TC using the Influx CLI
CREATE DATABASE worldserver
CREATE USER grafana WITH PASSWORD 'grafana'
GRANT READ ON worldserver TO grafana
Installing Grafana
- Download and install Grafana from http://docs.grafana.org/installation/
- Open the dashboard at http://localhost:3000
- Login with username admin and password admin (defaults can be changed in Grafana's .ini files)
- Go to
Data Sources→+ Add Data Source
Name: Influx
Type: InfluxDB
Url: http://localhost:8086
Access: Proxy
Database: worldserver User: grafana Password: grafana - Go to
Dashboards→Importand import each .json file in TrinityCore's /contrib/grafana
Configuring TrinityCore
- Edit the worldserver.conf file
- Set
Metric.Enable = 1 - Edit
Metric.ConnectionInfowith connection details (e.g"127.0.0.1;8086;worldserver") - Start worldserver, the dashboard should now start receiving values
Implemented  and planned
  metrics
Technical oriented
- I/O networking traffic:
- Packets sent
- Packets received
- Average ping
- Traffic in
- Traffic out
- Packets sent
- World session update time
- Map update time
- Map loads/unloads
- MMap queries
- Database async queries queued count
- Server uptime (through world initialize and world shutdown events)
- Active connections
- Queued connections
- CPU usage
- RAM usage
Game oriented
- Players online
- Logins per hour, per day, day of week, etc
- Mails sent
- Auction house usage
- Character levels
- Gold earn/spend
- LFG queues
We'd like help implementing these and other metrics, feel free to pull request the implementation of these metrics or any other.
Adding new metrics
There are two kinds of metrics that can be logged: values and events.
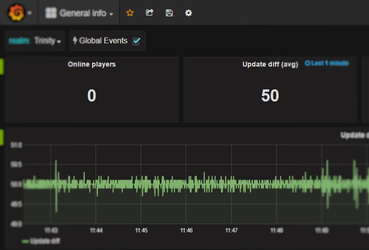
Values correspond to measurements of a certain quantity, like number of online players or the update diff time.
Events are something that occurs in an instant of time, e.g, a player login, worldserver shutdown, etc..
To log new metrics, call TC_METRIC_EVENT or TC_METRIC_VALUE and add a new graph to the dashboard.
TC_METRIC_EVENT(category, title, description)
- category: Arbitrary string, table where the values and events are stored. By convention, event logs should be suffixed by "_events";
- title: Name of the event log;
- description: Additional info about a log event;
TC_METRIC_VALUE(category, value)
- category: Same as above;
- value: A measurement, it can have one of the following types: bool, std::string, float, double or any integral type (int, int32, uint, etc).
// Registering player logins: in WorldSession::HandlePlayerLogin(LoginQueryHolder* holder)
TC_METRIC_EVENT("player_events", "Login", pCurrChar->GetName());

// Logging the update diff time: in World::Update(uint32 diff)
TC_METRIC_VALUE("update_time_diff", diff);
Additional Reading
Learn more about InfluxDB and Grafana: